Archives: NZ Political Party Polls

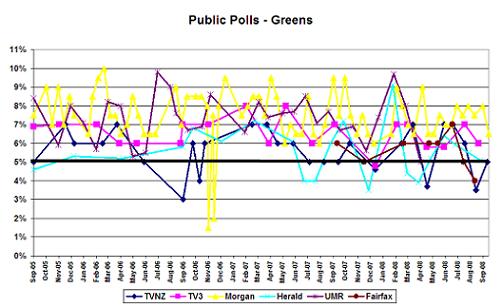
Green Party Polling

September 19, 2008

This follows on from the NZ First poll comparison. Again Roy Morgan has the Green Party higher than the otehr companies – but less so than with New Zealand First.

Polling on New Zealand First

September 19, 2008

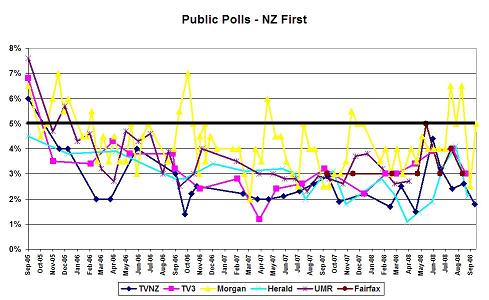
The graph above shows how NZ First have done in every public poll since the 2005 election.

There appears to be a significant difference between the level of support for NZ First in the Roy Morgan polls, as opposed to the five other polling companies. This is not to say Roy Morgan is necessarily wrong – just that there is some sort of systematic or methodological recurring reason why they show a higher level of support.

I don’t have available the full methodology used by Roy Morgan, so it is hard to speculate on why they get such different results. It might be linked to the fact they poll around 60 people a day and report in two week intervals, rather than the shorter time frames of the other polls.

Polling Company: Roy Morgan Research

Poll Method: Random Phone

Poll Size: 823 (3.5% maximum margin of error)

Dates: 01 September to 14 September 2008

Client: Self Published

Report: Roy Morgan Website

Party Support

  • National 47.5% (+3.0%)
  • Labour 36.5% (-1.5%)
  • Green 6.5% (-1.5%)
  • NZ First 5.0% (+2.5%)
  • Maori 1.5% (-2.0%)
  • United Future 0.5% (-0.5%)
  • ACT 1.5% (nc)
  • Progressive 0.0% (nc)
  • Other 1.0% (nc)
Projected Seats
  • National 57
  • Labour 44
  • Green 8
  • NZ First 6
  • Maori 6
  • United Future 1
  • ACT 2
  • Progressive 1
  • Total 125
This is based on Maori Party winning six electorate seats and ACT, United Future and Progressive one each.
Coalition Options
  • National 57 + ACT 2 + United Future 1 + Maori 6 = 66/125 – majority possible
  • National 57 +Maori 6 = 63/125 – majority possible
  • Labour 44 + Progressive 1 + Greens 8 + NZ First 6 + Maori 6 = 65/125 = majority possible
The easiest option for both National and Labour to get a majority of at least 63 is shown. It is assumed ACT would only go with National and Progressive and NZ First only go with Labour. For National next options after ACT, in order of ease, are United Future, Maori Party, and Greens. For Labour next options after Progressive and NZ First in order of ease are Greens, Maori Party and United Future.
Country Direction
  • Right 44.0% (-6.5%)
  • Wrong 41.0% (+5.5%)
  • Can’t Say 15.0% (+1.0%)

NZ Herald DigiPoll August 2008

September 6, 2008

Polling Company: DigiPoll

Poll Method: Random Phone

Poll Size: 750 respondents, (3.6% maximum margin of error)

Dates: 3 August to 25 August 2008

Client: NZ Herald

Report: NZ Herald main story and breakdowns here and graphs here.

Party Support

  • National 50.0% (-5.4%)
  • Labour 36.3% (+5.5%)
  • Green 5.1% (-0.4%)
  • NZ First 2.1% (-2.0%)
  • Maori 3.1% (+0.5%)
  • United Future 0.0% (-0.9%)
  • ACT 2.3% (+2.1%)
  • Progressive 0.0% (nc)
Projected Seats
  • National 62
  • Labour 45
  • Progressive 1
  • NZ First 0
  • Green 6
  • United Future 1
  • Maori 6
  • ACT 1
  • Total 124
This is based on Maori Party winning six electorate seats and ACT, United Future and Progressive one each.
Coalition Options
  • National 62 + ACT 3 = 65/124 – majority possible
  • Labour 45 + Progressive 1 + Greens 6 + Maori 6 + United Future 1 = 59/124 = no majority possible
The easiest option for both National and Labour to get a majority of at least 63 is shown. It is assumed ACT would only go with National and Progressive only go with Labour. For National next options after ACT, in order of ease, are United Future, Maori Party, and Greens. For Labour next options after Progressive in order of ease are Greens, NZ First, Maori Party and United Future.

Preferred PM

  • Key 46.6% (-0.5%)
  • Clark 45.0% (+1.0%)
  • Peters 5.6% (+0.7%)

Most influential issue

  • Economy 24.7% (+1.8%)
  • Law & Order 17.0% (-0.2%)
  • Tax Cuts 16.3% (-0.2%)
  • Hospital Waiting Lists 13.8% (nc)

Hamilton East and West polls

September 1, 2008

The Waikato Times and Versus Research have done polls in Hamilton East and Hamilton West.

Their online report does not specify the sample size or dates of the polls apart from “Monday and Tuesday evenings”.

Hamilton West Electorate Vote

  • Tim Macindoe (Nat) 37%
  • Martin Gallagher (Lab) 35%
  • Don’t Know 24%

Hamilton East Electorate Vote

  • David Bennett (Nat) 61%
  • Sue Moroney (Lab) 14%
  • Don’t Know 14%

Hamilton Party Vote

  • National 49%
  • Labour 25%
  • National 58% PV in Ham East and 40% in Ham West

TV3/TNS Poll August 2008

August 25, 2008

Polling Company: TNS

Poll Method: Random Phone

Poll Size: 1,000 (3.2% maximum margin of error)

Dates: 14 August to 20 August 2008

Client: TV3

Report: TV3

Party Support

Party Support

  • National 48.0% (nc)
  • Labour 37.0% (+2.0%)
  • Green 6.0% (-1.0%)
  • NZ First 3.0% (-1.0%)
  • Maori 2.0% (nc)
  • United Future 1.0% (+0.7%)
  • ACT 2.0% (+1.0%)
  • Progressive 0.0% (nc)
Projected Seats
  • National 60
  • Labour 46
  • Green 7
  • NZ First 0
  • Maori 6
  • United Future 1
  • ACT 3
  • Progressive 1
  • Total 124
This is based on Maori Party winning six electorate seats and ACT, United Future and Progressive one each.
Coalition Options
  • National 60 + ACT 3 = 63/124 – majority possible
  • Labour 46 + Progressive 1 + Greens 7 + Maori 6 + United Future 1 = 61/124 = no majority possible
The easiest option for both National and Labour to get a majority of at least 63 is shown. It is assumed ACT would only go with National and Progressive only go with Labour. For National next options after ACT, in order of ease, are United Future, Maori Party, NZ First and Greens. For Labour next options after Progressive in order of ease are Greens, NZ First, Maori Party and United Future.
Preferred PM
  • Key 34.0% (+2.0%)
  • Clark 31.0% (+3.0%)
  • Peters 3.0% (-2.0%)
  • English 3.0% (+2.0%)
Leader Ratings
  • Clark – 63% (+6%) performing well vs 22% (-7%) performing badly
  • Key – 56% (+6%) performing well vs 20% (-3%) performing badly

Fairfax poll on NZ First

August 18, 2008

The Dominion Post reports further results from the Fairfax/Nielsen poll, on the issue of NZ First:

  • 48 per cent of voters believe Peters should be stood down from his ministerial positions over questions surrounding donations to NZ First, with 37% disagreeing and 15% unsure
  • On whether NZ First should be involved in discussions after the election about the formation of the next government, 37% support a Labour doing a deal with NZ First and 52% against. For a deal with National 26% say yes and 54% say no.

Polling Company: Colmar Brunton

Poll Method: Random Phone

Poll Size: 1,009 total voters and 908 decided voters (3.2% and 3.4% maximum margins of error)

Dates: 9 August to 14 August 2008

Client: One News

Report: TVNZ

Party Support

  • National 51.0% (-1.0%)
  • Labour 37.0% (+2.0%)
  • Green 3.5% (-2.5%)
  • NZ First 2.6% (+0.2%)
  • Maori 3.1% (+1.4%)
  • United Future 0.7% (+0.7%)
  • ACT 0.6% (-0.6%)
  • Progressive 0.0% (nc)
Projected Seats
  • National 66
  • Labour 48
  • Green 0
  • NZ First 0
  • Maori 6
  • United Future 1
  • ACT 1
  • Progressive 1
  • Total 123
This is based on Maori Party winning six electorate seats and ACT, United Future and Progressive one each.

Preferred PM

  • Key 36.0% (-2.0%)
  • Clark 33.0% (+2.0%)
  • Peters 3.0% (-1.0%)


Fairfax Poll August 2008

August 16, 2008

Polling Company: Nielsen

Poll Method: Random Phone

Poll Size: 1,102 total voters, 981 decided voters (3.3% maximum margin of error)

Dates: 6 to 12 August 2008

Client: Fairfax Media

Report: Stuff and Stuff

Party Support

  • National 54.0% (+3.0%)
  • Labour 35.0% (nc)
  • Green 4.0% (-1.0%)
  • NZ First 3.0% (-1.0%)
  • Maori 2.0% (nc)
  • United Future 0.0% (nc)
  • ACT 1.0% (nc)
  • Progressive 0.0% (nc)
Projected Seats
  • National 70
  • Labour 46
  • Green 0
  • NZ First 0
  • Maori 6
  • United Future 1
  • ACT 1
  • Progressive 1
  • Total 125
This is based on Maori Party winning six electorate seats and ACT, United Future and Progressive one each.

Preferred PM

  • Key 43.0% (+4.0%)
  • Clark 31.0 (-1.0%)
  • Peters 2.0% (-1.0%)
Issues
  • 35% think National can afford significantly bigger tax cuts than Labour, 48% disagree
  • 45% think personal finances get better in next 12 months, 30% worse

Polling Company: Roy Morgan Research

Poll Method: Random Phone

Poll Size: 836 (3.5% maximum margin of error)

Dates: 28 July to 10 August 2008

Client: Self Published

Report: Roy Morgan Website

Party Support

  • National 48.0% (+0.5%)
  • Labour 34.0% (+1.5%)
  • Green 7.5% (-0.5%)
  • NZ First 6.5% (+1.5%)
  • Maori 2.0% (-1.0%)
  • United Future 0.0% (-0.5%)
  • ACT 1.5% (-1.0%)
  • Progressive 0.0% (nc)
  • Other 0.5% (-0.5%)
Breakdowns are also given for Auckland, Wellington, Christchurch, Other NI and Other SI.
Projected Seats
  • National 58
  • Labour 41
  • Green 9
  • NZ First 8
  • Maori 6
  • United Future 1
  • ACT 2
  • Progressive 1
  • Total 126
This is based on Maori Party winning six electorate seats and ACT, United Future and Progressive one each.
Country Direction
  • Right 44.5% (+6.0%)
  • Wrong 41.0% (-6.0%)
  • Can’t Say 14.5% (nc)
Get our paywalled newsletter on polling insights Subscribe

Get Curia's blog posts
via email